By Ron Moore, Managing Partner, The RM Group, Inc.
During the global financial crisis, Jack Welch suggested that you should “Cut costs deeper than you’d like, fixate on operational details to wring out all the excess, and focus on cash as if your life depends on it.” On the other hand, a study conducted by Mascio of the S&P 500 over an 18-year period concluded that during a recession, those who cut deepest delivered smaller profits as long as nine years after a recession. Was Jack wrong in his suggestion to cut deeper than you’d like? My advice is to be tenacious about his second and third suggestions. Costs are a consequence of your systems and practices. Costs are to be managed, not cut, and reduced through waste elimination and process and productivity improvement. There is a huge difference between managing and cutting.
If you want lower costs, you must get your processes right. Simple cost-cutting will remove resources from your system without changing the underlying system design, and performance will likely deteriorate. Unfortunately, my experience has been that when times are good, most U.S. companies can’t afford the time to allow people to participate in process improvement activities. Or, when times are bad, they can’t afford the money for process improvement. It’s a dilemma.
So, how do we convince executives to make the time and money available for process improvement? Use the safety mantra. Every company I know has stated that safety is a top priority. Few companies I know have reliability as a top priority. However, the data are compelling that a reliable plant is a safe plant, and a cost-effective plant is an environmentally-sound plant. At times I have challenged executives regarding their position that safety is a top priority, mostly because their operational reliability is pretty ordinary. If you believe in safety, you must believe in reliability and have related policies and practices that are aggressively implemented. Let’s consider the data below to support this position.
Focus on Reliability and Defect Elimination
First of all, what are some of the indicators of a reliable operation? My experience is that these include:
- Overall Equipment Effectiveness (OEE), or Asset Utilization (AU), both of which measure the percent of ideal at which a plant is operating – the higher the OEE or AU, the more reliable the plant;
- Reactive/Corrective Maintenance – the fewer breakdowns and reactive work orders, the more reliable the operation;
- Preventive and Predictive Maintenance – the more PM and PdM you do, the more reliable your plant;
- Schedule Compliance – the more disciplined you are about executing your plans, the more reliable the operation.
The data below are exemplary of a much broader set of data, not “one-of”, or “cherry-picked”. Correlation coefficients, R, are shown on each plot. The data support the basic premise that if you are reliable, you will be able to operate at very high levels; you won’t need to be very reactive; your systems will be stable and in control; and your costs, safety, and environmental performance will improve.
The following graph is from a large U.S. manufacturing company over a five-year period (10+ plants across the world, $7B in annual revenue). Look at the data and see what you think it suggests.
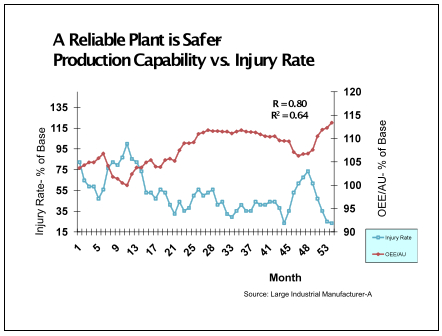
Figure 1: Production Capability (OEE) vs. Injury Rate
The data have been normalized, that is, a base number was selected and all the other numbers were divided by the base number. The correlation coefficient, or R, is 80% for this data, a remarkable correlation for industrial data. This data makes the argument that when the plants are running well (high Asset Utilization), then injuries are less likely. You’re not reacting to the most recent failure and risking injury, as well as higher costs and poorer overall performance.
Further, consider Figures 2 and 3 below from a large chemical plant over an eight-year period. Each data point represents one year’s worth of injuries, and the same year’s total work orders of the type indicated. Injuries per year are all injuries, including “first aid” ones. PM (preventive maintenance is time-based) and PdM (predictive maintenance is condition-based) is work performed in a planned fashion and relates to a specific time-based action (e.g., lubricating bearings monthly) or to an equipment condition action (e.g., detecting a fault that requires a planned repair within the next month to minimize its consequence to cost and downtime). Corrective and reactive work orders are those done in a relatively unplanned or unexpected manner, e.g., equipment failed – repair as soon as possible.
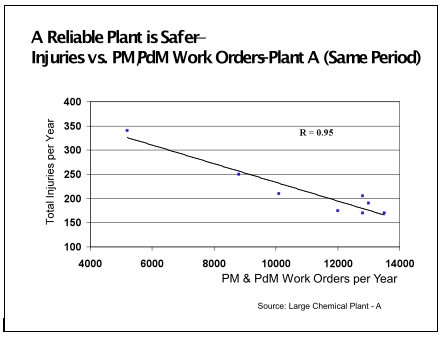
Figure 2: Injuries vs. PM/PdM Work Orders per year
As the data in Figure 2 illustrates, the more PM/PdM work (in control), the fewer the injuries. My experience has also been that the higher percentage of PM/PdM work at a given plant, the lower the costs, and the higher the OEE, which can be seen in Figure 4 later.
Next, consider Figure 3, which is data from the same plant during the same time period. Only this time, we’re measuring the number of corrective and reactive work orders in a given year and comparing it to the injuries that same year. It indicates that the more corrective and reactive work is done, the higher the injury rate.
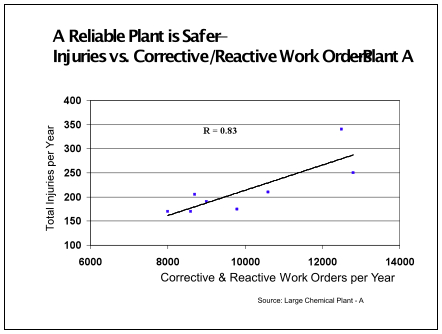
Figure 3: Injuries vs. Corrective and Reactive Work Orders per year
My experience has also shown that the more reactive a plant is, the lower the OEE and the higher the costs. Reactive work is routinely reported to cost two to five times more than planned work. Further evidence of this is provided in Figures 4 through 7 below.
Figure 4 represents data from some 180 manufacturing plants, mostly process industries, and indicates that the more reactive a plant, the lower the OEE, and vice versa. And, since the total work must be 100%, the more PM and PdM work done, the higher the OEE. A reliable plant is typically more productive than a reactive plant.
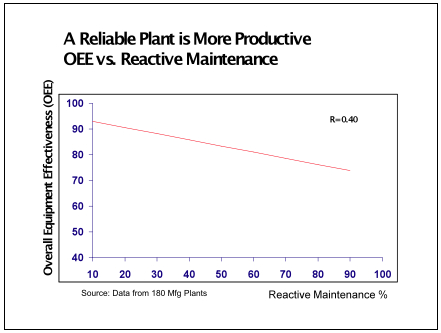
Figure 4: OEE vs. Percent Reactive Maintenance
Moreover, a reliable plant is a more cost-effective plant. Consider the data in Figure 5 from another large manufacturer with global operations.
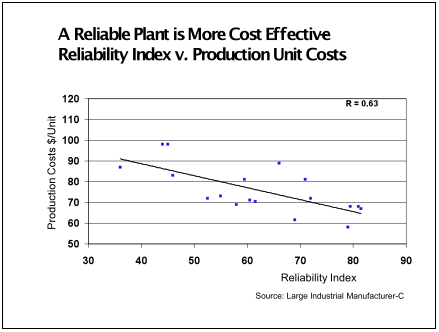
Figure 5: Production Unit Costs vs. Reliability Index
In Figure 5, the reliability index is based on the composite score related to over 600 questions or issues at a given plant, which reflects its practices and processes with regard to applying reliability principles. In this data, some of the plants with lower scores in reliability still have relatively low costs, primarily because they have structural advantages. For example, if energy costs are significantly lower, then reliability can be poorer, and the same relative unit costs can be achieved. Thus, you’ll see considerable variability in the data because of structural advantages, or disadvantages, in labor, raw material, and energy costs. That said, the data do demonstrate that if you want sustainably lower costs, get your reliability processes right. If you simply cut costs, your results are not likely to be sustainable. You may see some immediate improvement over 6-12 months, but over subsequent years, there will be a price to be paid in poorer performance and higher costs.
Regarding the use of PM and PdM (condition monitoring) work, consider Figure 6 below, where the level of Condition Monitoring/Predictive Maintenance is strongly correlated to lower maintenance costs.
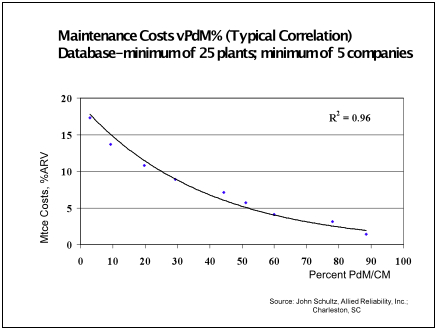
Figure 6: Maintenance Costs v. Condition Monitoring
Note: Work Management and Planning & Scheduling MUST be excellent to act
on findings of PdM; and a proactive mindset is necessary for defect elimination.
Maintenance costs are reported as a percent of asset replacement value (ARV). Percent PdM is the percentage of the appropriate equipment that is being routinely monitored. Note that the data from your condition monitoring program must be comprehensively linked to excellence in work management and the planning and scheduling function; and a strong proactive approach must be used in eliminating the defects that caused the failures that were detected in the first place.
Further, the discipline necessary for work management and its relationship to making a safer work environment is illustrated in Figure 7, below, which is data from five large manufacturing sites of yet another large global industrial manufacturer during a particular year.
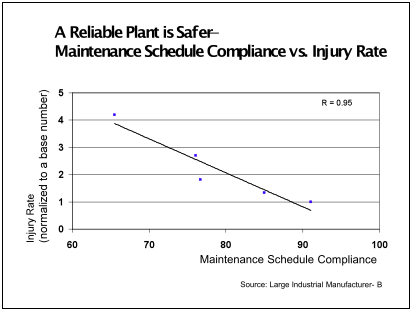
Figure 7: Injury Rate v. Maintenance Schedule Compliance
Finally, reliable plants tend to be more environmentally r sound. Consider Figure 8 below, from a large chemical plant. Again, the data have been normalized, that is, a base number has been selected and all other numbers are divided by it to determine the percentage of improvement.
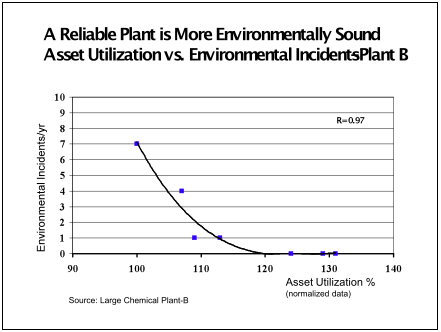
Figure 8: Environmental Incidents vs. Asset Utilization
It’s important to point out that the data have considerable variability, and that correlation is not caused and effect. However, you can infer cause and effect or a common cause to the different variables. Based on the above exemplary data, a strong case can be made that a reliable plant is a safe plant, is a cost-effective plant, and is an environmentally-sound plant. You can get improvement in safety by just focusing on safe work practices; in costs by just focusing on costs, and in environmental performance by just focusing on environmental issues. However, if you want all three simultaneously, you must be reliable; you must do many things really well, and be tenacious about all your practices.
Achieving Reliability
So, how do we achieve reliability? Focus on getting the processes right. Reliable plants maximize benefits – production capability, on-time delivery, quality, lower costs, higher gross profits (that finance future investments in business and product development), and of course growth in customer satisfaction, market share, earnings per share and share price. And, reliable plants minimize risks – the risk of injury, risk of production loss, risk of higher costs and risk of major incidents. Trying to sustain earnings per share in the short term by simple cost-cutting will not likely serve you well in the long term. Indeed, it is more likely to put you at greater risk of future failures. Cost management through improved processes and defect and waste elimination are critical to your success. Consider the model in Figure 9, below.
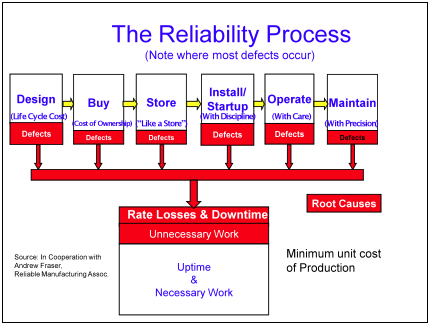
Figure 9: The Reliability Process
We must eliminate the defects, and we must have discipline in our processes. Note where most defects occur that result in un-reliability, i.e., design, installation/startup, and operation. Further, in existing operations, we have less control over the first three functions – design, buy, and store, but we have much more control over the last three. If you’re starting with a new plant or equipment, use concepts of life cycle cost, the total cost of ownership, and running your storeroom “like a store” (a business), not an afterthought.
For most, the plant they have is the plant they have. So in the short term, they should focus on improved installation, startup (after major maintenance or project efforts, or changeovers) and shutdown practices, along with better operating practices. That’s where most of the defects are induced. Studies indicate that 1) you are seven to 17 times more likely to induce defects (and environmental and safety problems) during startup than you are during normal operation; and 2) that some 67% of failures occur in the infant mortality pattern, wherein the great risk of failure is during the first 30 days or so after startup. Moreover, data from the Japanese Institute of Plant Management and other studies indicate that some 70% of defects that result in equipment and process failures are induced by poor operating practices, e.g., poor startup and shutdown, poor operation, inconsistent operation across shifts, poor changeover practices, etc. And, if you want lower operating and maintenance costs – start by eliminating the defects in operations that result in production losses and maintenance requirements; and assure a comprehensive maintenance planning and scheduling process, one driven by condition monitoring and defect elimination.
Conversely, if you remove resources from your business system (layoffs and budget cuts) before getting the right processes in place and eliminating the defects, you will be at much greater risk of not being able to perform to market expectations when the markets do bounce back. You will have “wrung out the costs”, but you will also have wrung out the capability to perform to market expectations. And, you’ll be at greater risk of injury.
Leadership, Alignment, and Change
Supporting a reliability model requires leadership, alignment and almost always, cultural change. My view of leadership is that it’s the ability to inspire ordinary people to consistently perform at an extraordinary level, and to look forward to coming to work, every day. How? Put employees and contractors into a business system that engages and aligns their personal interests with corporate interests. Give them work they like to do; challenge them to improve it; give them the tools to improve it; put them on an improvement team; teach them problem-solving methods; when they do a good job, thank them and show your appreciation; send them to training, but when they return, make sure they use the training received. In other words, engage them. According to one study, engaged employees are three times more productive than average. According to another, eliminating the small day-to-day problems has a much bigger impact on performance than focusing on the major problems. Think of hundreds of people routinely engaged in process improvement and defect elimination – think about what happens to costs, to performance.
Alignment requires the repeated articulation of a strategy, set of goals and respective roles from the CEO to the shop floor, along with measures and systems that reinforce the strategy, goals, and roles. It is really hard work. According to the studies, most organizations are not very well aligned. Most functions within a given organization operate within their silo, optimizing at the suboptimal level. Having everyone think at a systems level as to the impact their decisions will have on the business as a whole, and aligned to a common corporate strategy, not just their department’s, is essential.
Finally, regarding the cultural change, when asked “Do people want to change?” many people will reply something to the effect of “No, they do not; they’re stuck in their old ways.” I disagree with this view. I strongly believe that people do want to change if given a compelling reason to change if there’s something in it for them (better pay, less hassle, more secure future, etc.), and if they participate in creating the changes (and thus have ownership for them). It’s up to the leadership of the organization to align the organization and facilitate change by applying these principles; and, using safety as a compelling reason for the change.
To this end, and given the above data, we must have a policy for reliability, one that parallels our safety policy. Consider one company’s specific safety policy, to which I’ve added the words in italics:
- All injuries, and failures, are preventable.
- No task is so urgent that it cannot be done safely, and reliably.
- Management must provide a safe, and reliable, work environment.
- We are each responsible for preventing injuries, and failures.
- Everyone is empowered to stop unsafe, and unreliable, behavior.
Granted, some failures have little consequence. If we’ve made a conscious decision that this is acceptable, then it’s not a failure in our system. We intended to run to failure as part of our system design.
Finally, anyone who has been through a safety initiative understands that to improve safety, you must go through a series of specific steps to drive the improvement process. These are listed below.
- Top-down leadership – clear consistent expectations
- Bottom-up ownership and employee engagement
- Education and training
- Action plans and measures
- Visual communication of expectations
- Standards and procedures
- Benchmarking and aggressive goals
- Audits and assessments
- Root cause focus
- Rewards (& willingness to challenge non-compliance)
- Resources for supporting improvement
- Continuous improvement expectations and process
- A culture – a way of life
All the companies I’ve worked with have policies and strategies similar to those related to safety. Few companies have these policies as it relates to reliability. Moreover, if the CEOs of these companies truly believe that safety is a top priority, they must have similar policies for reliability. The truth is they do not. They must, or else their commitment to safety is weak.
Ron Moore is Managing Partner of The RM Group, Inc. in Knoxville, TN. Ron is author of Making Common Sense Common Practice: Models for Manufacturing Excellence, and of What Tool? When? A Management Guide for Selecting the Right Improvement Tools.
© Life Cycle Engineering, Inc.